Microsoft Power BI is a dynamic data visualization tool that empowers business intelligence. It is a vital part of the Microsoft Power Platform, integrating services, applications, and connectors for turning varied data sources into engaging visual narratives. Users can leverage data from databases, websites, and structured files like spreadsheets and CSV files. Power BI encompasses cloud services and a desktop interface, providing features for data preparation, discovery, interactive dashboards, and warehousing. Its unique ability to integrate user-created custom visuals allows for personalized functionality, enhancing business analytics. The UNAVOIDS NCDF space, as a Power BI visual, will be accessible in the Power BI Visuals Marketplace for seamless integration into reports, promoting interactive data exploration alongside other Power BI tools.
Developing UNAVOIDS as a Power BI Custom Visual
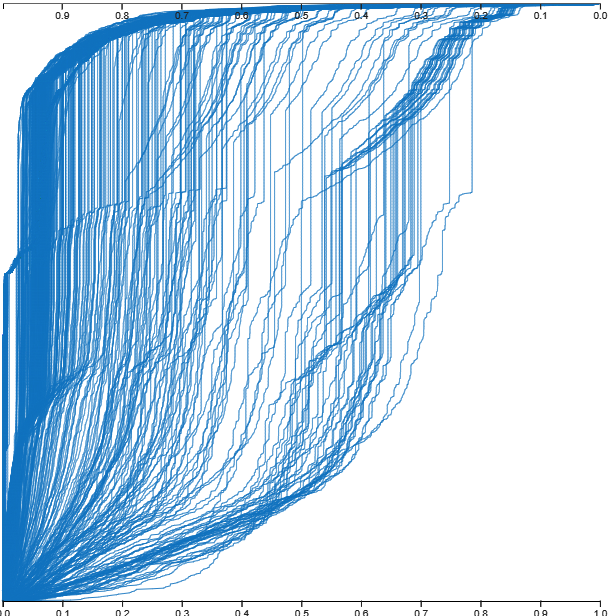
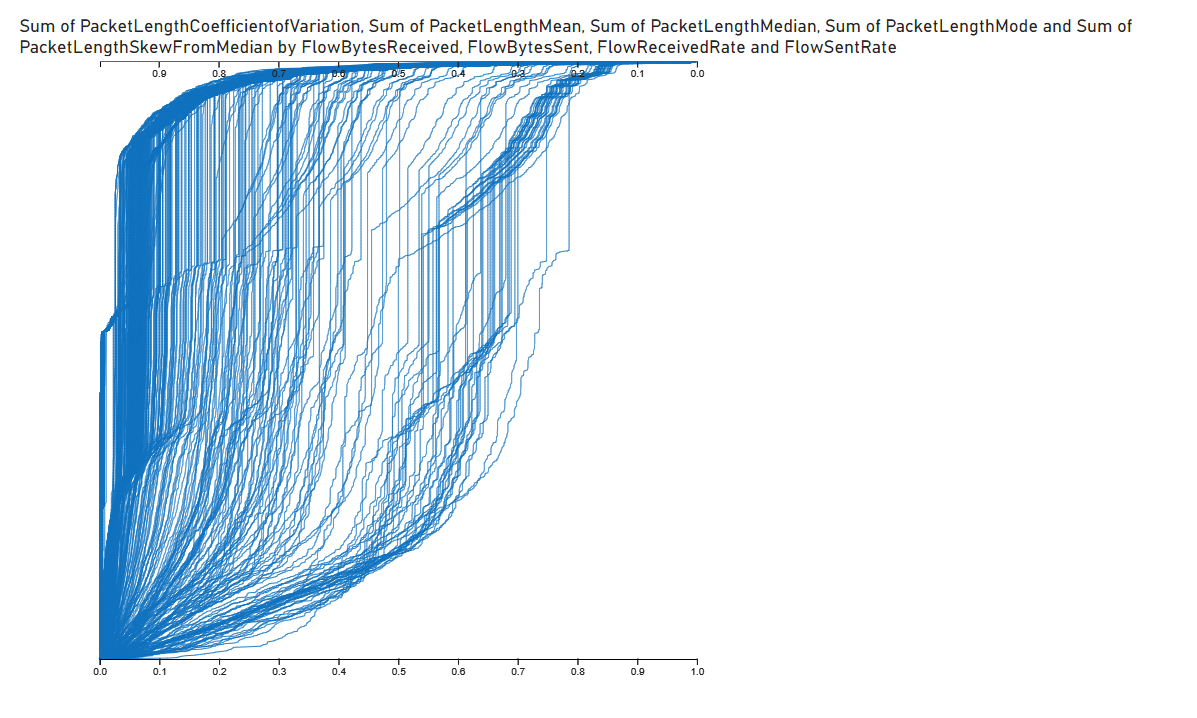
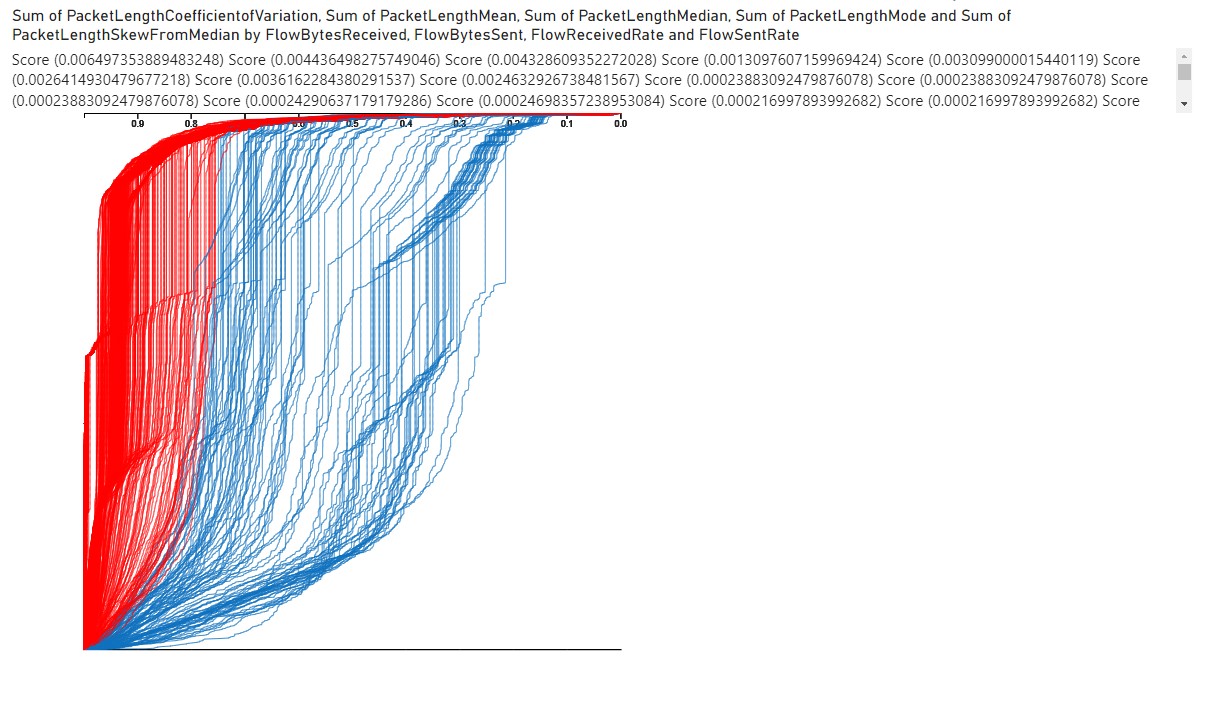
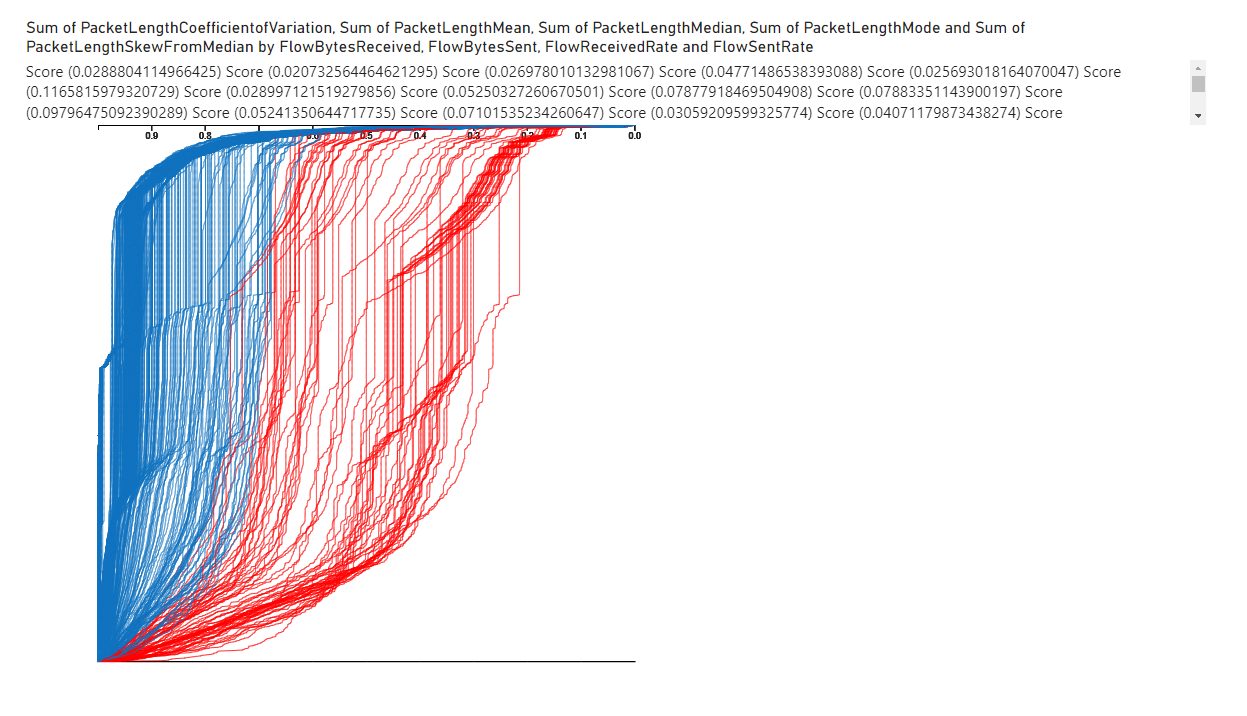
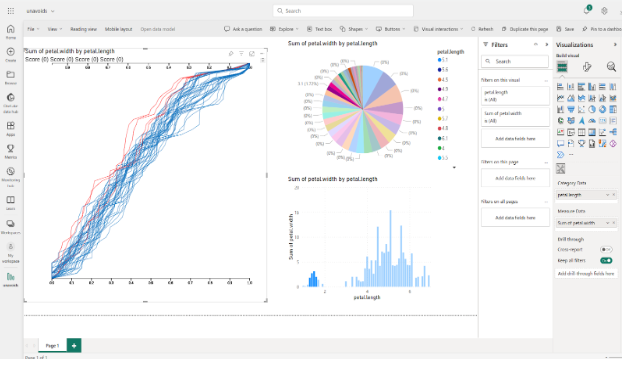
We created a Microsoft Power BI custom visual to display the NCDF space of UNAVOIDS from scratch. During the implementation, special attention was given to ensuring the interactivity of the UNAVOIDS visual with other Power BI visuals in the same environment (call report in PowerBI jargon), all sharing the same data source.